What drives the price of commodities?

When most people think about what determines the price of a particular commodity such as gold or crude oil, they only consider supply and demand economics. This is after all what we’re most familiar with: when summer comes around and the weather warms up, we get into our car more often and go for a drive or a longer road trip. Since we use more gas during the summer months, demand is up. Gas stations respond by jacking up the price of gasoline.

Another example many of us are familiar with takes place during the cold winter months. To heat our homes, we use more energy, using commodities such as natural gas or heating oil. Since we use more of them for heating purposes, this increases demand and, you guessed it, drives up the price for those commodities during the winter season. If you look at long term charts for energy commodities, it becomes clear that prices follow this cyclical pattern with seasonal spikes.

But commodity prices don’t always follow a predictable pattern, because changes in supply and demand often are independent. For example, several years ago, oil and gas exploration companies developed the hydraulic fracturing technology required to extract shale gas. Gas production soared, and the increase in supply has driven natural gas prices (including those of natural gas ETFs) to ten year lows.

A fair market price is set based on supply and demand for the commodity. Or as Karl Marx once put it: “From the taste of wheat it is not possible to tell who produced it, a Russian serf, a French peasant or an English capitalist.” And so the price of wheat for two equivalent bushels should be the same.

But in addition to the supply/demand equilibrium, there is another important factor at play: speculation. Take for example gold. Sure, there is high demand for the metal in electronics and other industries, as a currency reserve, and for other reasons. But there are also a lot of investors who are simply attracted to the rising price of gold, and want to “get in on some of that action.”

There are now over 70 billion U.S. dollars invested in the most widely held gold ETF. That means that through this one exchange traded security, investors now own more gold bullion than the reserve bank of most large nations such as China, Russia, Switzerland, or Japan!

Popularity feeds on itself. The financial media are out in force, advertising gold ETFs in newspapers, magazines, and on TV shows. If that’s not speculation, I don’t know what is.

Another example of a speculative run-up in commodities was when hedge fund managers (and others) in 2007-2008 loaded up on commodities, fueling a massive increase in their prices. When they all exited in mass during the next year (as the global economic crisis unfolded) the prices of many commodities plummeted, and have still not recovered to this date. Commodities are not the only market that exhibits speculative behavior. We’ve seen it in stocks (think Nasdaq dot-coms in the late 1990s), real estate, tulip bulbs, you name it.

In summary, the price of commodities is determined not just by fundamental reasons, but also speculation by various participants in this dynamic market. Sometimes the speculative return component drives commodity prices far beyond any reasonable valuation, leading invariably to an eventual collapse of the bubble.
What’s the best natural gas ETF?

Most investors interested in natural gas ETFs are familiar with the funds that track natural gas futures contracts. Popular examples include the United States Natural Gas ETF (UNG) and iPath Dow Jones UBS Natural Gas ETN (GAZ).

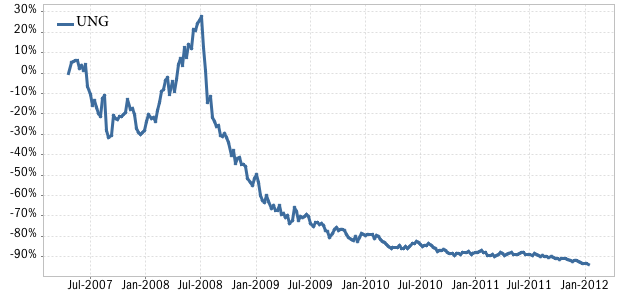
But this is not necessarily the best way to invest in this sector of the commodities markets. The price of natural gas has declined in recent years, and an investor who has bought these funds would be having a tough time, as shown in the historical price chart of UNG below:

UNG natural gas ETF

Since it started trading in May 2007, the UNG fund has lost 94% of its value. And an investment in GAZ would have fared the same. (The performance of the GAZ fund closely mirrors UNG, although it was launched a few months later in October 2007).

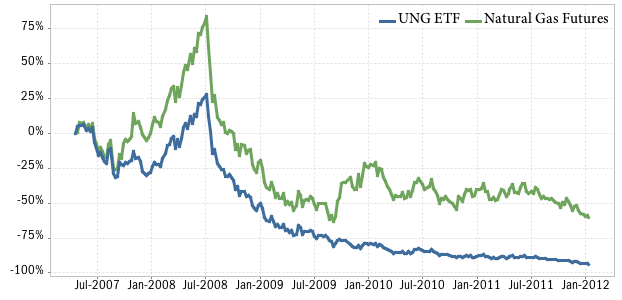
This poor performance is in part due to the price of natural gas futures, which have been in decline since 2008. But that’s not the only reason. As you can see in the graph below, on a percentage basis, the UNG fund has decreased a lot more than the price of natural gas futures, even though it is supposed to track these commodities closely:

natural gas prices vs UNG ETF

That’s not the way an index fund should look when compared to its index; the performance should be virtually identical. Again, we don’t mean to pick on UNG, the GAZ fund performs just as poorly.

Why the huge discrepancy? Why is the ETF price so different from the natural gas futures it is supposed to track? Is it due to the expense ratio of the ETF? That’s part of it. These ETFs have relatively high expense ratios, which will definitely create a drag on the price. In the case of the UNG fund this costs and investor 0.85% per year, and 0.75% for GAZ. But that doesn’t explain the entire difference.

So what else is going on here? In a word: contango. Contango refers to a situation that occasionally happens when futures contracts are rolled over from one month to the next. Since the UNG and GAZ ETFs both hold natural gas futures contracts, they need to roll these contracts forward every month as the old contract expiration date approaches. New contracts sometimes have a slightly higher price than the old one, and this is what is known as contango. Each time the ETF managers roll into a new contract, it costs them a bit more, and these price discrepancies create a huge performance difference over longer periods of time. This is clearly shown in the chart above, where the price of natural gas futures declined 60% during this period. That’s bad, but not nearly as awful as the 93% decline in value of the UNG fund during the same time!

So what is a natural gas investor to do? Fortunately, there is a better way to invest in this commodity.

A better way to invest in natural gas

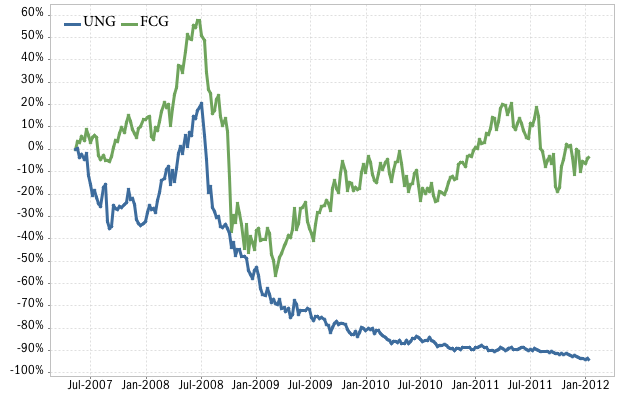
Enter the First Trust ISE-Revere Natural Gas Index Fund (FCG). This ETF has been on the market since May 2007. What’s different about this fund is that it invests in stocks, not futures contracts. More specifically, it aims to track the ISE-REVERE Natural Gas Index, which consists of stocks that derive a substantial part of their revenue from the exploration and production of natural gas. The index includes some household names like ExxonMobil, ConocoPhillips, and Royal Dutch Shell. Sure, these companies engage in oil exploration also, so in that regard, the FCG ETF is not a “pure play” on natural gas. But it sure performs a lot better than the futures based natural gas ETFs. Lets compare the historical performance of FCG against the UNG fund, since inception:

UNG natural gas ETF vs FCG

There. Isn’t that better? Since inception, FCG is about at break-even (minus 4%), while UNG has lost 94% of its value. More importantly, FCG has appreciated significantly since the bear market bottom in early 2009, while UNG just continues to decline.

In summary, investors interested in a natural gas ETF should seriously consider the FCG fund, and stay away from futures-based funds like UNG and GAZ. Frankly, I’m a bit puzzled why investors have poured 1.06 billion dollars into UNG (its current assets under management), whereas FCG has attracted a relatively modest $354 million. And if you’re looking for a natural gas pure play, stick to the actual futures contracts.