What drives the price of commodities?

When most people think about what determines the price of a particular commodity such as gold or crude oil, they only consider supply and demand economics. This is after all what we’re most familiar with: when summer comes around and the weather warms up, we get into our car more often and go for a drive or a longer road trip. Since we use more gas during the summer months, demand is up. Gas stations respond by jacking up the price of gasoline.

Another example many of us are familiar with takes place during the cold winter months. To heat our homes, we use more energy, using commodities such as natural gas or heating oil. Since we use more of them for heating purposes, this increases demand and, you guessed it, drives up the price for those commodities during the winter season. If you look at long term charts for energy commodities, it becomes clear that prices follow this cyclical pattern with seasonal spikes.

But commodity prices don’t always follow a predictable pattern, because changes in supply and demand often are independent. For example, several years ago, oil and gas exploration companies developed the hydraulic fracturing technology required to extract shale gas. Gas production soared, and the increase in supply has driven natural gas prices (including those of natural gas ETFs) to ten year lows.

A fair market price is set based on supply and demand for the commodity. Or as Karl Marx once put it: “From the taste of wheat it is not possible to tell who produced it, a Russian serf, a French peasant or an English capitalist.” And so the price of wheat for two equivalent bushels should be the same.

But in addition to the supply/demand equilibrium, there is another important factor at play: speculation. Take for example gold. Sure, there is high demand for the metal in electronics and other industries, as a currency reserve, and for other reasons. But there are also a lot of investors who are simply attracted to the rising price of gold, and want to “get in on some of that action.”

There are now over 70 billion U.S. dollars invested in the most widely held gold ETF. That means that through this one exchange traded security, investors now own more gold bullion than the reserve bank of most large nations such as China, Russia, Switzerland, or Japan!

Popularity feeds on itself. The financial media are out in force, advertising gold ETFs in newspapers, magazines, and on TV shows. If that’s not speculation, I don’t know what is.

Another example of a speculative run-up in commodities was when hedge fund managers (and others) in 2007-2008 loaded up on commodities, fueling a massive increase in their prices. When they all exited in mass during the next year (as the global economic crisis unfolded) the prices of many commodities plummeted, and have still not recovered to this date. Commodities are not the only market that exhibits speculative behavior. We’ve seen it in stocks (think Nasdaq dot-coms in the late 1990s), real estate, tulip bulbs, you name it.

In summary, the price of commodities is determined not just by fundamental reasons, but also speculation by various participants in this dynamic market. Sometimes the speculative return component drives commodity prices far beyond any reasonable valuation, leading invariably to an eventual collapse of the bubble.

Performance of commodity ETFs versus U.S. stocks

In this article I’ll take a look at how commodity index funds have performed when compared to an investment in U.S. stocks. The equity benchmark I’ll use is the S&P 500 Total Return index, which measures the performance of the 500 largest U.S. stocks, including their dividends.

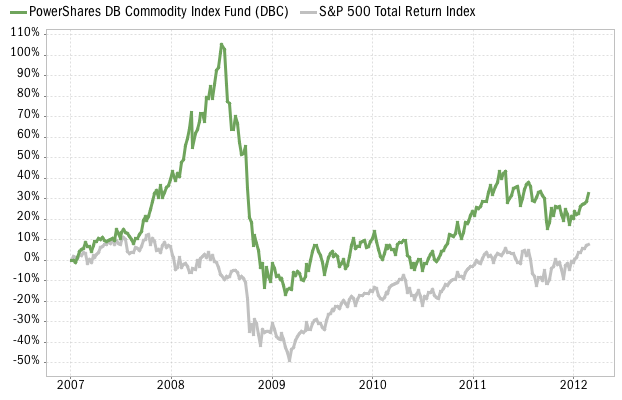
First up is the Powershares DB Commodity Index Fund (DBC), which was introduced in January 2007. It is currently the most popular commodity index fund, with 6.39 billion dollars under management, an annual expense ratio of 0.85% and average trading volume of 2.5 million shares per day. Between inception and its peak in mid 2008, the fund gained over 100% in value. But its subsequent decline of over 60 percent was more severe than that of stocks during the same period (the S&P 500 lost 55% of its peak value). Still, an investor in DBC would have fared better than a U.S. stock investor, as can be seen in the chart below.

DBC commodity ETF performance vs S&P 500 Index

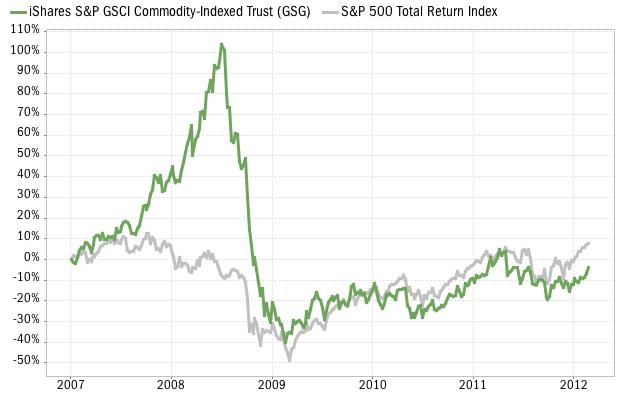
Lets now take a look at is the iShares S&P GSCI Commodity-Indexed Trust (GSG), which also started trading at the beginning of 2007. With 1.42 billion dollars in assets under management, this is the 2nd most widely held commodity index ETF. Its expense ratio of 0.75% is slightly lower than DBC. With an average of 408,000 shares trading hands per session, it is also less liquid. Like DBC, this fund had a sharp run up until the summer of 2008, more than doubling an investor’s money. But it’s subsequent decline was even more severe: it lost over 71 percent of its peak value within a matter of months. The volatility of GSG (annualized standard deviation) is 29.4%, higher than that of the S&P 500 (26.2%). Commodities in general have not appreciated as much as stocks since March 2009, and as a result, an investment in the S&P 500 has outpaced GSG since inception, as shown in the chart:

GSG commodity ETF performance vs S&P 500 Index

Commodities add some value as a means to diversify a portfolio. You can see this clearly in the above charts: both DBC and GSG continued to rally during the first half of 2008, long after the bear market in U.S. stocks had already started. In retrospect, part of this return appears to have been speculative investments by hedge funds and other players. Still, when risky assets started to be sold off across the board in the second half of 2008, commodity funds provided no shelter or buffering for an investor’s portfolio.

In summary, by these measures you can see that commodities can certainly enjoy large gains during a short time period, but they are also riskier than large cap stocks, w.r.t. their volatility and maximum drawdown.

A look at the most popular gold ETF and ETNs

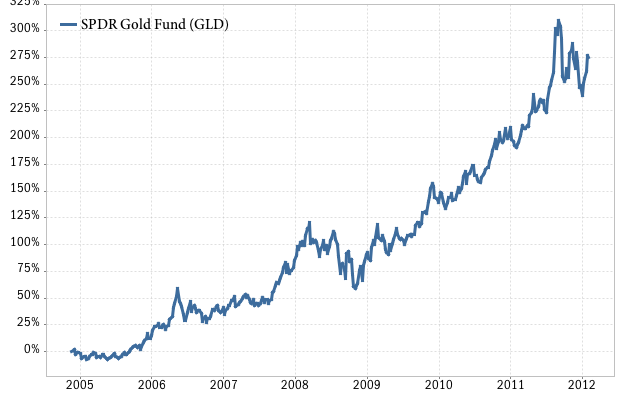
Many investors turn to ETFs as a convenient way to participate in the gold market, without having to be exposed to the inconvenience and risks of buying and storing physical gold bars or bullion, or the complications of trading gold futures contracts. The first gold ETF was listed on the U.S. market in November 2004: the SPDR Gold Fund (GLD). The GLD fund has become so popular that it is now the second most widely held ETF in the world, with over 70.6 billion dollars under management. As a comparison, that’s more than the entire gold reserves of China! GLD invests in physical gold bullion, and the gold bars are held in the vaults of HSBC bank in London. If you’re so inclined, you can actually go to the website of SPDR Gold Shares and view a document listing every bar currently held by the fund (the file is over 1,700 pages long!) Each GLD share represents 1/10th of an ounce of gold.

SPDR gold ETF

The chart above shows the performance of the GLD ETF since it started trading. An investor who had bought GLD shares in November 2004 would be looking at an over 300% gain by August 2011. Gold prices have come down a bit since then, but are still holding on to a very healthy 279% gain since 2004. That’s a compound annual return of just over 20 percent. With returns like these, it is no wonder that investors are flocking to the GLD ETF.

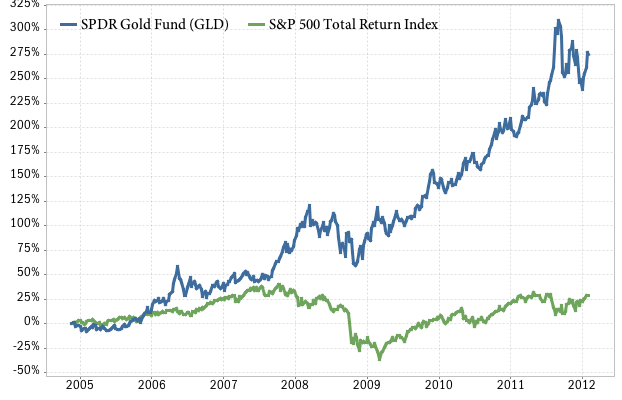
Next, we’ll take a look at how gold has performed compared to U.S. large cap stocks (represented by the S&P 500 index). As you can see, the S&P 500 compound annual return of 3.59 percent is barely noticeable compared to the stellar performance of gold:

SPDR gold ETF vs S&P 500

It is also worth noting that even during the most severe price declines of the 2008-2009 recession, gold declined no more than 27.7% from its peak value, compared to a loss of 54.6% for U.S. stocks. OK, now lets look at some other popular gold ETFs.

Another very popular gold ETF is iShares COMEX Gold Trust (IAU), with 9.7 billion dollars under management. This ETF began trading in January 2005. Like the GLD fund, IAU also invests in physical gold bullion. The cost of securing and storing gold is significant and creates a performance drag on all gold ETFs that invest in the physical metal. Investors should be aware that the annual expense ratio of IAU is 0.25%, significantly lower than the 0.40% for GLD. If your goal is to establish a long-term position in gold, then IAU is definitely the way to go as it will outperform GLD and SGOL (see below) over time due to its lower expense ratio.

Up next is the ETFS Gold Trust (SGOL), which was introduced in September 2009. Even though this is a fairly recent addition, SGOL has already accumulated about 1.9 billion dollars under management, making it the third most widely held gold ETF. Like GLD and IAU, this fund also invests in physical gold bullion, and stores its gold bars in secure bank vaults in Zurich, Switzerland. With an annual expense ratio of 0.39%, it’s also not as efficient as the IAU fund.

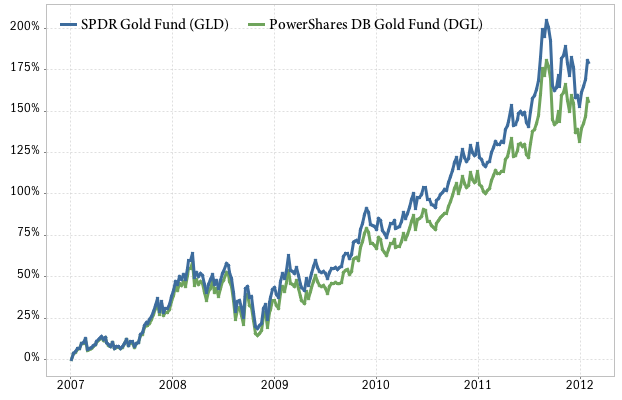
The PowerShares DB Gold Fund (DGL) is a different kind of gold ETF. Rather than holding physical gold bullion, this fund trades gold futures contracts. Lets compare it to GLD and see how that’s worked out so far:

gold ETF comparison: GLD vs DGL

Hmmmm. Not so good for the DGL fund, as you can see in the chart above. It has trailed the GLD fund significantly since its inception date in January 2007. An investor in DGL would have ended up with 23.1% less in gains over this time period. That makes bullion funds like IAU and GLD much better candidates for most gold investors. But there is one caveat: taxation. In the U.S., gold bullion is classified as a collectible, and is taxed at a rate of 28%, much higher than the normal 15% long-term capital gains tax on other securities, so ETFs like GLD and IAU are subject to this high rate. The tax treatment of futures based ETFs is complex (and I’m not an accountant, so seek professional help!). In general, gains and losses in a fund like DGL would be treated as 60% long-term and 40% short-term capital gains, giving it an edge in tax efficiency over bullion funds. However, judging by the large difference in actual performance, I would say that bullion funds are still a better investment option. Investors seem to agree: as of this writing, the DGL fund has about 410 million dollars under management, less than 6% the amount invested in the GLD fund.

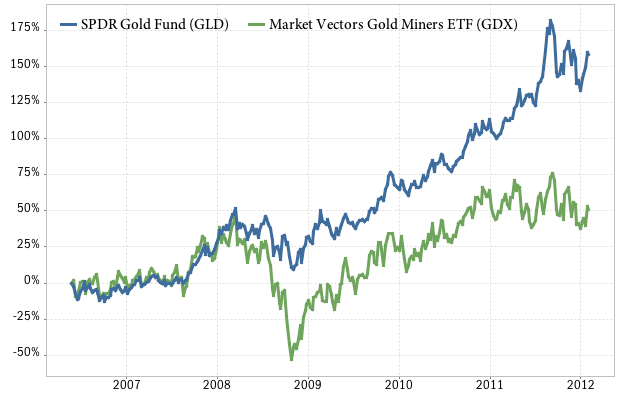
The last gold fund we’ll look at today is the Market Vectors Gold Miners ETF (GDX). This is an index fund that invests in the common stocks of companies involved in the gold mining industry. It replicates the performance of the NYSE Arca Gold Miners Index. As you’d expect, this fund behaves differently from a pure gold bullion ETF:

gold ETF comparison: GLD vs GDX

Since its inception in May 2006, it has significantly lagged the price of gold (as represented by GLD), and has compounded at a mere 7.54% annual rate, compared to 18.16% for GLD over the same period. What should also be obvious from the above chart is how fast and far the gold miners dropped during the economic recession in 2008-2009. The GDX fund had a maximum drawdown of 68.45%, much higher than the 27.73% in GLD over the same period (and also worse than the performance of stocks). GDX’s volatility (annualized standard deviation) is also more than twice as high as GLD. Also notable is the fact that the gold miners have basically been trading in the same range since the end of 2010, whereas the price of gold has continued to enjoy significant gains since then. Still, the GDX has accumulated 9.63 billion dollars in assets under management.

Some investors describe GDX as a “leveraged play on gold.” It costs the mining companies a certain amount of money per ounce to extract and refine the metal, and beyond a certain point, as the price of gold rises “everything else is gravy.” I’ve seen this effect in 2002-2004, before the price of gold really took off. If you can identify small, barely profitable mining companies early on in an uptrend, watch out! But there are other factors at play. Gold miners are generally speaking not U.S. companies (many are in Canada, South Africa, and elsewhere). That makes an investment in GDX subject to some currency risk (the value of the US dollar compared to foreign currencies).

Conclusion

So far, we’ve looked at five of the most popular gold ETFs. Both IAU and GLD are excellent “pure play” ways to invest in the gold market, and I give the nod to IAU because of its significantly lower annual expense ratio. The last time I checked, there were 51 different ETFs and ETNs to trade gold! In addition to bullion funds, futures based gold funds, and gold miners, there are inverse (short) ETFs, leveraged products (2x, 3x exposure), and a number of other ways to invest in (or bet against) the shiny metal. But that’s the subject of a future blog post.

What’s the best natural gas ETF?

Most investors interested in natural gas ETFs are familiar with the funds that track natural gas futures contracts. Popular examples include the United States Natural Gas ETF (UNG) and iPath Dow Jones UBS Natural Gas ETN (GAZ).

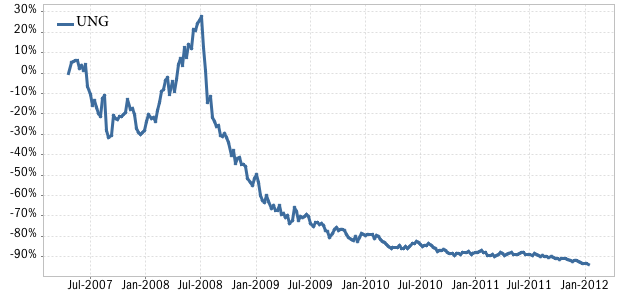
But this is not necessarily the best way to invest in this sector of the commodities markets. The price of natural gas has declined in recent years, and an investor who has bought these funds would be having a tough time, as shown in the historical price chart of UNG below:

UNG natural gas ETF

Since it started trading in May 2007, the UNG fund has lost 94% of its value. And an investment in GAZ would have fared the same. (The performance of the GAZ fund closely mirrors UNG, although it was launched a few months later in October 2007).

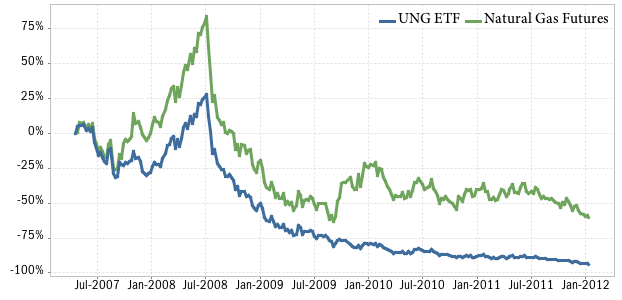
This poor performance is in part due to the price of natural gas futures, which have been in decline since 2008. But that’s not the only reason. As you can see in the graph below, on a percentage basis, the UNG fund has decreased a lot more than the price of natural gas futures, even though it is supposed to track these commodities closely:

natural gas prices vs UNG ETF

That’s not the way an index fund should look when compared to its index; the performance should be virtually identical. Again, we don’t mean to pick on UNG, the GAZ fund performs just as poorly.

Why the huge discrepancy? Why is the ETF price so different from the natural gas futures it is supposed to track? Is it due to the expense ratio of the ETF? That’s part of it. These ETFs have relatively high expense ratios, which will definitely create a drag on the price. In the case of the UNG fund this costs and investor 0.85% per year, and 0.75% for GAZ. But that doesn’t explain the entire difference.

So what else is going on here? In a word: contango. Contango refers to a situation that occasionally happens when futures contracts are rolled over from one month to the next. Since the UNG and GAZ ETFs both hold natural gas futures contracts, they need to roll these contracts forward every month as the old contract expiration date approaches. New contracts sometimes have a slightly higher price than the old one, and this is what is known as contango. Each time the ETF managers roll into a new contract, it costs them a bit more, and these price discrepancies create a huge performance difference over longer periods of time. This is clearly shown in the chart above, where the price of natural gas futures declined 60% during this period. That’s bad, but not nearly as awful as the 93% decline in value of the UNG fund during the same time!

So what is a natural gas investor to do? Fortunately, there is a better way to invest in this commodity.

A better way to invest in natural gas

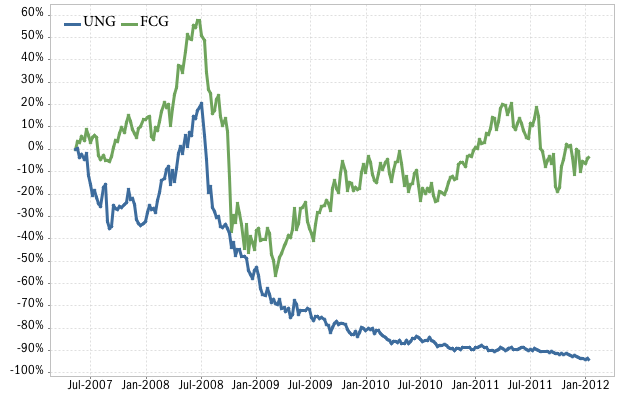
Enter the First Trust ISE-Revere Natural Gas Index Fund (FCG). This ETF has been on the market since May 2007. What’s different about this fund is that it invests in stocks, not futures contracts. More specifically, it aims to track the ISE-REVERE Natural Gas Index, which consists of stocks that derive a substantial part of their revenue from the exploration and production of natural gas. The index includes some household names like ExxonMobil, ConocoPhillips, and Royal Dutch Shell. Sure, these companies engage in oil exploration also, so in that regard, the FCG ETF is not a “pure play” on natural gas. But it sure performs a lot better than the futures based natural gas ETFs. Lets compare the historical performance of FCG against the UNG fund, since inception:

UNG natural gas ETF vs FCG

There. Isn’t that better? Since inception, FCG is about at break-even (minus 4%), while UNG has lost 94% of its value. More importantly, FCG has appreciated significantly since the bear market bottom in early 2009, while UNG just continues to decline.

In summary, investors interested in a natural gas ETF should seriously consider the FCG fund, and stay away from futures-based funds like UNG and GAZ. Frankly, I’m a bit puzzled why investors have poured 1.06 billion dollars into UNG (its current assets under management), whereas FCG has attracted a relatively modest $354 million. And if you’re looking for a natural gas pure play, stick to the actual futures contracts.

Commodity Index Funds

Commodity index funds purchase futures contracts to track the price of a broad basket of commodities. There are currently more than 10 exchange traded funds of this kind. Each fund tracks a different underlying index, and the specific commodities and weights vary significantly. In this post, I’ll take a closer look at the top four commodity index funds, ranked by total assets under management:

  • PowerShares DB Commodity Index Tracking ETF (DBC)
  • iPath Dow Jones UBS Commodity Index ETN (DJP)
  • iShares S&P GSCI Commodity-Indexed Trust ETF (GSG)
  • Elements Rogers International Commodity Index ETN (RJI)

Index Weights

When analyzing a commodity index fund, it helps to group its holdings into five major categories: Energy, Precious Metals, Industrial Metals, Livestock, and Agriculture. While all these funds track a broad basket of commodities, their composition varies significantly. The table below shows these differences, by looking at the percentages allocated to each major commodity category:

Percentage Allocation /
Commodity Category
DBC
[details]
DJP
[details]
GSG
[details]
RJI
[details]
Energy 56.00% 34.42% 69.40% 44.00%
Precious Metals 9.94% 17.53% 3.90% 7.10%
Industrial Metals 12.84% 15.02% 7.00% 14.00%
Livestock 0.00% 6.37% 4.70% 3.00%
Agriculture 21.20% 26.66% 15.00% 31.90%

Understanding the difference in these index weights can help you make a better investment decision. For example, investors in GSG and DBC should not be surprised that their ETF price is heavily influenced by the price of oil and gas commodities (comprising 69% of GSG and 56% of DBC). DBC doesn’t track Livestock commodities at all, whereas the other funds allocate as much as 6.4% to this category. GSG has a relatively small 3.9% allocation to precious metals, compared to 17.5% for DJP. Rogers RJI allocates almost 32% to agricultural commodities, more than double GSG’s 15% allocation in this category.

Individual Commodities Tracked

The funds also differ significantly with respect to the individual commodities they track. DBC tracks the fewest commodities (14), while RJI tracks the broadest basket (36). Investors seeking the broadest and most balanced commodity basket may be best served with RJI or DJP, whereas investors who care more about the relative importance of each commodity (as tracked by futures trading volume) should stick to one of the other ETFs.

The table below shows the detailed composition of each fund:

Percentage Allocation /
Commodity
DBC
[details]
DJP
[details]
GSG
[details]
RJI
[details]
Brent Oil 12.41% 16.70% 14.00%
Crude Oil 13.41% 16.93% 32.70% 21.00%
Heating Oil 12.56% 4.42% 5.40% 1.80%
RBOB Gasoline 12.34% 3.76% 4.60% 3.00%
Natural Gas 5.28% 9.31% 2.80% 3.00%
Gas Oil 7.20% 1.20%
Gold 8.02% 13.72% 3.35% 3.00%
Silver 1.92% 3.81% 0.55% 2.00%
Platinum 1.80%
Palladium 0.30%
Copper 4.32% 6.41% 3.30% 4.00%
Aluminum 4.17% 4.50% 2.20% 4.00%
Zinc 4.35% 2.47% 0.50% 2.00%
Nickel 1.65% 0.60% 1.00%
Lead 0.40% 2.00%
Tin 1.00%
Live Cattle 4.00% 2.70% 2.00%
Feeder Cattle 0.50%
Lean Hogs 2.36% 1.50% 1.00%
Corn 5.22% 7.25% 4.50% 4.75%
Soybeans 5.50% 6.64% 2.30% 3.35%
Soybean Oil 2.61% 2.17%
Soybean Meal 0.75%
Canola 0.67%
Sugar 5.29% 2.68% 2.20% 2.00%
Wheat 5.19% 3.69% 2.80% 7.00%
Kansas Wheat 0.70%
Barley 0.10%
Oats 0.50%
Rice 0.50%
Coffee 2.47% 0.90% 2.00%
Cocoa 0.30% 1.00%
Orange Juice 0.66%
Azuki Beans 0.15%
Cotton 1.33% 1.30% 4.20%
Lumber 1.00%
Rubber 1.00%
Greasy Wool 0.10%

PowerShares DB Commodity Index Tracking ETF (DBC)

This fund tracks the Deutsche Bank Optimum Yield Diversified Commodity Index Excess Return. It holds futures contracts on 14 of the most heavily-traded and important physical commodities in the world: Brent Crude, Light Crude, Heating Oil, RBOB Gasoline, Natural Gas, Gold, Silver, Copper – Grade A, Aluminum, Zinc, Corn, Soybeans, Sugar # 11, and Wheat. With over 5.5 billion U.S. dollars under management, it’s the most widely held commodity index fund. It started trading in February 2006, making it the first available commodity index fund. The chart below shows the percentage allocation to each commodity:
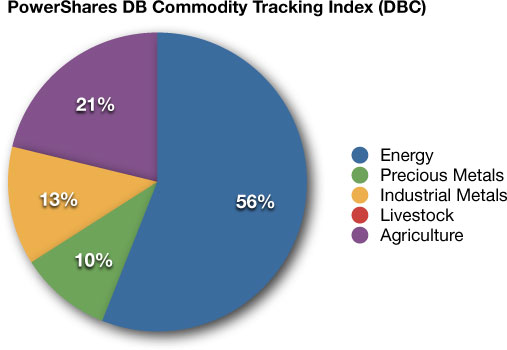
DBC commodity ETF portfolio allocation

iPath Dow Jones UBS Commodity Index ETN (DJP)

This ETN replicates the performance of the Dow Jones-UBS Commodity Index Total Return. It holds futures contracts for 19 different commodities: Crude Oil, Heating Oil, Unleaded Gas, Natural Gas, Gold, Silver, Copper, Aluminum, Zinc, Nickel, Live Cattle, Lean Hogs, Corn, Soybeans, Soybean Oil, Sugar, Wheat, Coffee, and Cotton. DJP was first made available to investors in July 2006. The chart below shows the percentage allocation to each commodity:
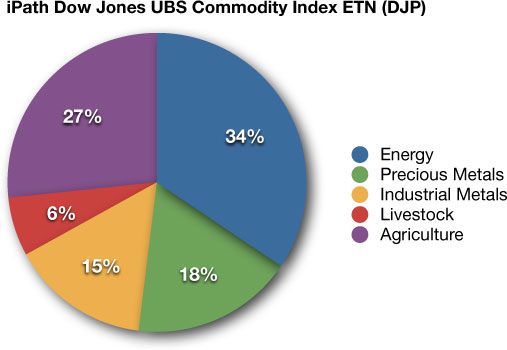
DJP commodity ETF portfolio allocation

iShares S&P GSCI Commodity-Indexed Trust ETF (GSG)

This fund tracks Standard & Poor’s GSCI index (formerly the Goldman Sachs Commodity Index). Unlike the other commodity ETFs, the GSCI is a tradable index (on the Chicago Mercantile Exchange), so this fund simply purchases CME futures contracts on this index (as well as the appropriate cash/bond balance to achieve 1x leverage). The GSCI index contains 24 commodities: Brent Crude, Crude Oil, Heating Oil, Unleaded Gasoline, Natural Gas, Gas Oil, Gold, Silver, Copper, Aluminum, Zinc, Nickel, Lead, Live Cattle, Feeder Cattle, Lean Hogs, Corn, Soybeans, Sugar, Wheat, Kansas Wheat, Coffee, Cocoa, and Cotton. The GSG fund started trading in October 2006. The chart below shows the percentage allocation to each commodity in the current index:
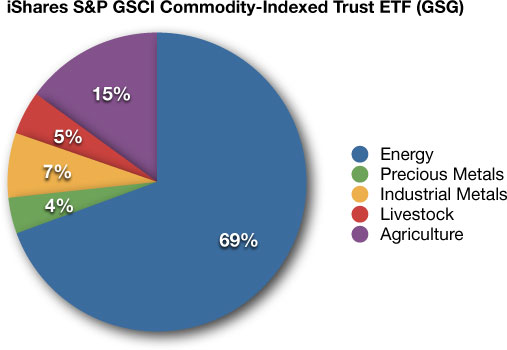
GSG commodity ETF portfolio allocation

Elements Rogers International Commodity Index ETN (RJI)

This ETN tracks the Rogers International Commodity Index (RICI), which consists of 38 different exchange-traded physical commodities, although the ETN currently only tracks 36: Brent Oil, Crude Oil, Heating Oil, RBOB Gasoline, Natural Gas, Gas Oil, Gold, Silver, Platinum, Palladium, Copper, Aluminum, Zinc, Nickel, Lead, Tin, Live Cattle, Lean Hogs, Corn, Soybeans, Soybean Oil, Soybean Meal, Canola, Sugar, Wheat, Barley, Oats, Rice, Coffee, Cocoa, Orange Juice, Azuki Beans, Cotton, Lumber, Rubber, and Greasy Wool. Two commodities (Milling Wheat and Rapeseed) are in the RICI but not tracked by the ETN (although these two only represent 1.25% of the index). The index was designed in the late 1990s by James (Jim) B. Rogers. The RJI fund was listed in October 2007. The chart below shows the percentage allocation to each commodity:
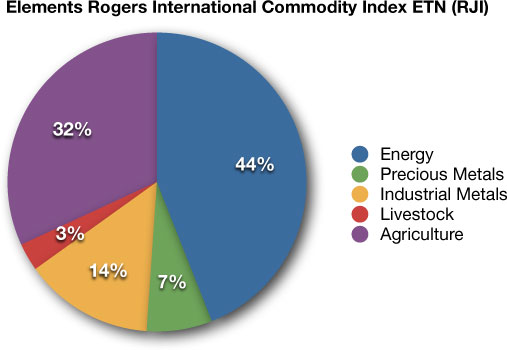
RJI commodity ETF portfolio allocation

Other Commodity Index Funds

While the four funds featured above are the most popular, they are not the only commodity ETFs that track broad baskets of commodities. Alternatives include:

  • GreenHaven Continuous Commodity Index Fund (GCC)
  • United States Commodity Index Fund (USCI)
  • ETRACS UBS Bloomberg Constant Maturity Commodity Index ETN (UCI)
  • Goldman Sachs Connect GSCI ETN (GSC)
  • ETRACS UBS DJ-UBS Commodity Index ETN (DJCI)
  • PowerShares DB Commodity Long ETN (DPU)
Different Types of Commodity ETFs

Commodity exchange traded funds are a relatively recent investment option. The first funds were introduced in 2006. They quickly caught on with investors, and there are now over one hundred different commodity funds. It’s not difficult to imagine a future where there’s a commodity ETF to track every single type of futures contract. Current offerings span the entire range of commodities, from Energy and Metals to Livestock and Agriculture. Some funds track broad baskets of commodities, while others zone in on one particular type of futures contract. Lets take a closer look at the different kinds of funds available in the market today.

Commodity Index Funds

These funds invest in a commodity index or hold a diverse portfolio of commodity futures contracts. As of this writing, the most popular ETFs in this category (as judged by assets under management) are:

  • PowerShares DB Commodity Index Tracking ETF (DBC), which tracks the performance of a Deutsche Bank index, composed of futures contracts on 14 of the most important and heavily traded physical commodities in the world.
  • iPath Dow Jones UBS Commodity Index ETN (DJP), which tracks an index of 19 commoditiy futures.
  • iShares S&P GSCI Commodity-Indexed Trust ETF (GSG), which tracks an index of 24 commoditiy futures.
  • Elements Rogers International Commodity Index ETN (RJI), which tracks an index of 36 commodity futures.

While these 4 securities are all broad commodity index funds, the composition of their indexes varies significantly. DBC tracks the fewest commodities (14), while RJI tracks the broadest basket (36). The commodity category weighting also differs significantly. For example, DBC and GSG are heavily weighted towards Energy commodities (Oil & Gas), with weights of 56% and 69% respectively, while DJP and RJI allocate 34% and 44% to Energy. The allocation to Agricultural commodities varies from 15% (GSG) to 32% (RJI). Precious Metals range from 3.9% (RJI) to 17.5% (DJP). DBC doesn’t include Livestock commodities, while the other ETFs allocate as much as 6.4% to this category.

Investors seeking the broadest and most balanced commodity basket may want to choose RJI or DJP, whereas investors who care more about the relative importance of each commodity (as tracked by futures trading volume) should stick to one of the other ETFs.

Agriculture ETFs

This fund category includes ETFs that track one or more agricultural commodities such as corn, wheat, and soybean futures. The most popular agriculture ETF is PowerShares DB Agriculture Fund (DBA), which tracks commodities such as live cattle, soybeans, sugar, corn, coffee, cocoa, lean hogs, wheat, and others.

The iPath Dow Jones AIG Grains Sub-Index ETF (JJG) tracks only corn, soybeans, and wheat futures. The iPath Dow Jones UBS Agriculture Sub-Index (JJA) tracks a broader basket of 7 agricultural commodities: corn, soybeans, wheat, sugar, soybean oil, coffee, and cotton.

Individual agricultural ETFs include the Teucrium Corn Fund (CORN), iPath Dow Jones AIG Cotton ETN (BAL), iPath Down Jones AIG Sugar ETN (SGG), and many other ETFs which track individual agricultural commodities such as coffee, cocoa, and wheat.

There are also three Livestock funds, the most popular of which is the iPath Dow Jones-UBS Livestock Subindex ETF (COW).

Energy ETFs

Energy ETFs track oil and gas commodities and futures contracts such as crude oil, natural gas, gasoline, and heating oil. The most popular ETF in this category is the United States Oil Fund (USO), which tracks crude oil. Another widely held choice is the United States Natural Gas Fund (UNG). Other funds track a broader basket of Energy commodities. For example, the PowerShares DB Energy Fund (DBE) tracks gasoline, brent crude, heating oil, light crude, and natural gas.

Industrial Metals ETFs

ETFs in this category track industrial metals such as copper, tin, nickel, aluminum, lead, and others. Most investors will choose an ETF that tracks a diversified industrial metals basket, such as the PowerShares DB Base Metals Fund (DBB). But there are also ETFs that track a single industrial metal, such as the iPath Dow Jones AIG Copper ETN (JJC), and the iPath Dow Jones AIG Tin ETN (JJT).

Precious Metals ETFs

Precious metals ETFs have become very popular. For example, the SPDR Gold Trust (GLD) is now the second largest exchanged traded fund, with over 71 billion U.S. dollars under management. As a comparison, the most widely held ETF is the SPDR S&P 500 ETF (SPY), with 92 billion dollars under management. One interesting feature about GLD is that it invests in actual gold bars, unlike many other commodity ETFs which use futures contracts. GLD started trading in 2004, in the middle of an enduring gold bull market. An investor who purchased shares in 2004 would have enjoyed gains of over 250% within seven years.

Another popular choice is the iShares Silver Trust (SLV), which invests in silver bars. The price of silver has risen dramatically since late 2008. SLV shares increased from a low of $8.45 to over $48 by April 2011, a rise of 472%. Silver is a volatile commodity, not for the faint at heart. For example, in 8 months between August 2010 and April 2011, its price increased by 164%, followed by a precipitous drop of 43% in the subsequent 5 months.

Investors interested in participating in the broader precious metals markets can purchase a fund like the ETF Securities Physical Precious Metal Basket Shares (GLTR) which holds gold, silver, platinum and palladium. Or if you mostly care about tracking gold and silver, there’s the PowerShares DB Precious Metals Funds (DBP).

More recently introduced precious metals ETFs include the ETF Securities Physical Platinum Shares (PPLT) and Physical Palladium Shares (PALL).

What is a Commodity ETF?

Since the dawn of modern investing, stocks and bonds have been the cornerstones of a diversified investment portfolio. But in recent decades, more and more investors have started participating in the commodities markets. There are many different ways to invest in commodities. You can buy them outright, or through futures contracts. Or you can own them indirectly by investing in commodity stocks (such as oil & gas exploration companies). Another increasingly popular option is to buy a commodity ETF or mutual fund. Many investors are familiar with mutual funds, and they have a lot of things in common with ETFs. An ETF is simply an Exchange Traded Fund. That means you can buy and sell its shares intraday, like a stock, on a stock exchange.

Five years ago, there were only a handful of commodity ETFs, but now there are over 100 listed funds. There are many different kinds of funds, and each invests in a specific type of commodity or basket of commodities. Here’s an overview of the different commodity ETF categories:

  • Commodity index funds, which invest in a broad basket of commodities. Popular examples include the iShares S&P GSCI Commodity-Indexed Trust ETF (ticker: GSG) and the PowerShares DB Commodity Index Tracking Fund (ticker: DBC).
  • Agricultural commodity ETFs (some investors refer to these as an agriculture ETF). These invest in a specific agricultural commodity (such as a wheat ETF or a corn ETF), or a basket of agricultural commodities.
  • Energy ETFs, including for example the United States Natural Gas ETF (ticker: UNG) and United States Oil ETF (ticker: USO).
  • Precious Metals ETFs, such as the popular gold ETF, the SPDR Gold Shares (ticker: GLD), or silver ETF: the iShares Silver Trust (ticker: SLV).
  • Industrial Metals ETFs track individual commodities such as copper, uranium, or broader baskets of industrial metals.

What’s In a Commodity ETF?

Many commodity ETFs hold futures or asset-backed contracts: they don’t buy the actual commodities but hold a contract to purchase them at some time in the future at a set price. But some commodity ETFs do actually buy hard assets. One example is the SPDR Gold Shares ETF (GLD). When investors purchase its shares, the fund invests in actual gold bars, stored in bank vaults in London and elsewhere. Some investors prefer these hard assets over a “piece of paper” (futures contract).

Some commodity securities are structured as an Exchange Traded Note (ETN). While these are similar to an ETF, there are some important distinctions. In particular, ETFs and ETNs are treated differently for taxation purposes. Gains on ETNs held for over one year are generally treated as long-term capital gains, whereas futures-based ETF gains are taxed annually and reported on IRS Schedule K-1. Also, because ETNs are a type of debt security (bond), their value may change based on the credit rating of the issuer. For example, if an issuer’s credit rating is downgraded, the ETN price may drop even though there’s no change in its underlying commodity index or futures contract. On the plus side, ETNs typically do a better job of tracking the underlying commodity prices.

Since commodity futures are leveraged investments and the goal of most commodity funds is to track the unleveraged (1x) return of their underlying commodity or index, the funds only invest a part of investor purchases in futures contracts, and use the remaining funds to purchase safe government bonds (such as U.S. Treasury Bills). The interest from these bonds helps to boost returns and offset the fund expenses.

Why Invest in Commodities?

There are many different reasons and strategies to participate in the commodities markets, including:

  • Strategic buy/hold allocation for hedging or diversification purposes. Commodities can diversify an investment portfolio, because they’re often not correlated to other asset classes like stocks and bonds. For example, you could allocate a small percentage of your portfolio to a gold, silver, or other commodity ETF.
  • Tactical asset allocation: commodities don’t always rise in value, so some investors prefer a tactical allocation that aims to only invest in them when they are trending up.
  • Managed Futures: professionally managed funds that often employ a trend-following strategy to buy and sell (or short) commodity futures. Many of these funds focus on diversification, risk-management, and remaining uncorrelated to other asset classes like stocks.

As with any other investment, conduct lots of research before you decide whether or not to include a commodity ETF in your investment portfolio.

In Summary

A commodity ETF means different things to different investors:

  • It can refer to a commodity index fund that tracks a broad basket of commodities
  • Or it can focus on a specific category such as Energy, Precious Metals, Industrial Metals, Livestock or Agricultural commodities
  • Or it can track a single commodity, such as a gold ETF.

Whatever your definition, there’s probably a fund among the 100+ exchange listed securities to fit your needs.